Table of contents
- Why use Intervals.icu to train with data
- What Intervals.icu is and what makes it different
- Create your account and link your first data source
- Inside the calendar
- Create and plan workouts
- The Fitness page: Fitness, Fatigue and Form
- The Power page: power curve and eFTP
- Wellness: weight, sleep, HRV and why it matters
- Analyse an activity
- Compare activities
- Working with a coach
- Other useful tools
- What is free and what is paid
- Conclusion
Why use Intervals.icu to train with data
There are two ways to use cycling data. One is to glance at it on Strava after each ride. The other is to centralise it, analyse it and use it to decide what to train and when. Intervals.icu is built for the second approach: organising almost all the relevant information from your training and turning it into a tool for analysis, planning and follow-up.
This guide walks through the platform from start to finish. The goal is not just to know where each page is, but to understand what to look at, what to configure first and how to use the information to train with better judgement.
What Intervals.icu is and what makes it different
Intervals.icu is a web platform for endurance athletes that combines analysis and planning. It imports your activities, analyses them interval by interval, tracks training load and form, builds your power curve, estimates parameters such as FTP or CP, records wellness data and lets you create and send structured workouts to your device. What is often spread across several tools in other platforms is concentrated in one place here.
The first difference is the price. The core platform is free indefinitely, with no limited trial and no hidden expiry date. There is a voluntary Supporter subscription, around €4 per month billed quarterly, which adds secondary features. Even so, most of what is useful for a cyclist is available in the free version. As a reference, TrainingPeaks Premium is usually in a much higher yearly range, while WKO5 works as a one-off paid licence.
The second difference is who is behind it. Intervals.icu is developed by David Tinker, who has been working full-time on the project since 2024, with a small team and a very active community in its forum. It is driven less by a closed commercial roadmap and more by the needs raised by the people who use the platform.
The third difference is its open and programmable nature. It has a public API, hundreds of third-party extensions and apps, and allows you to go far beyond the default metrics. You can create your own fields and charts, either manually, by reading data from the FIT file or by calculating them with JavaScript code that runs on each activity. This opens the door to any metric that makes sense for your analysis, even if it does not exist by default.
You also do not need to know how to code to take advantage of part of that potential. The data model is documented, so you can use an AI tool to help write a calculation if you explain which variable you need and where it should look for it. The Intervals.icu forum is a good starting point for examples, solved questions and fields created by the community.
It is worth positioning it against the tools you may already use. Strava is mainly a social network with light analysis. Garmin Connect is the cloud for your device. Intervals.icu does not fully replace them; it sits above them as a layer for analysis and planning. Many cyclists keep Strava for the social side and use Intervals.icu for training.
Create your account and link your first data source
You can sign up at Intervals.icu/signup. There are three routes: register with an email and password, connect with Strava or link Garmin Connect during the sign-up process so your activities are imported automatically. If you are not sure, the cleanest medium-term option is usually to create the account with email and then connect your device directly.
Once inside, the default screen is the calendar. Before you start planning sessions or interpreting charts, it is worth going through Settings. In Intervals.icu, a poor initial setup distorts almost everything you will see later.
Settings
The Settings page is the centre of the platform. The most common mistake when starting is not setting FTP and zones correctly. Training load, time in zones and a large part of the metrics you will use to make decisions are calculated from those values. If they are wrong, the analysis will also be biased.
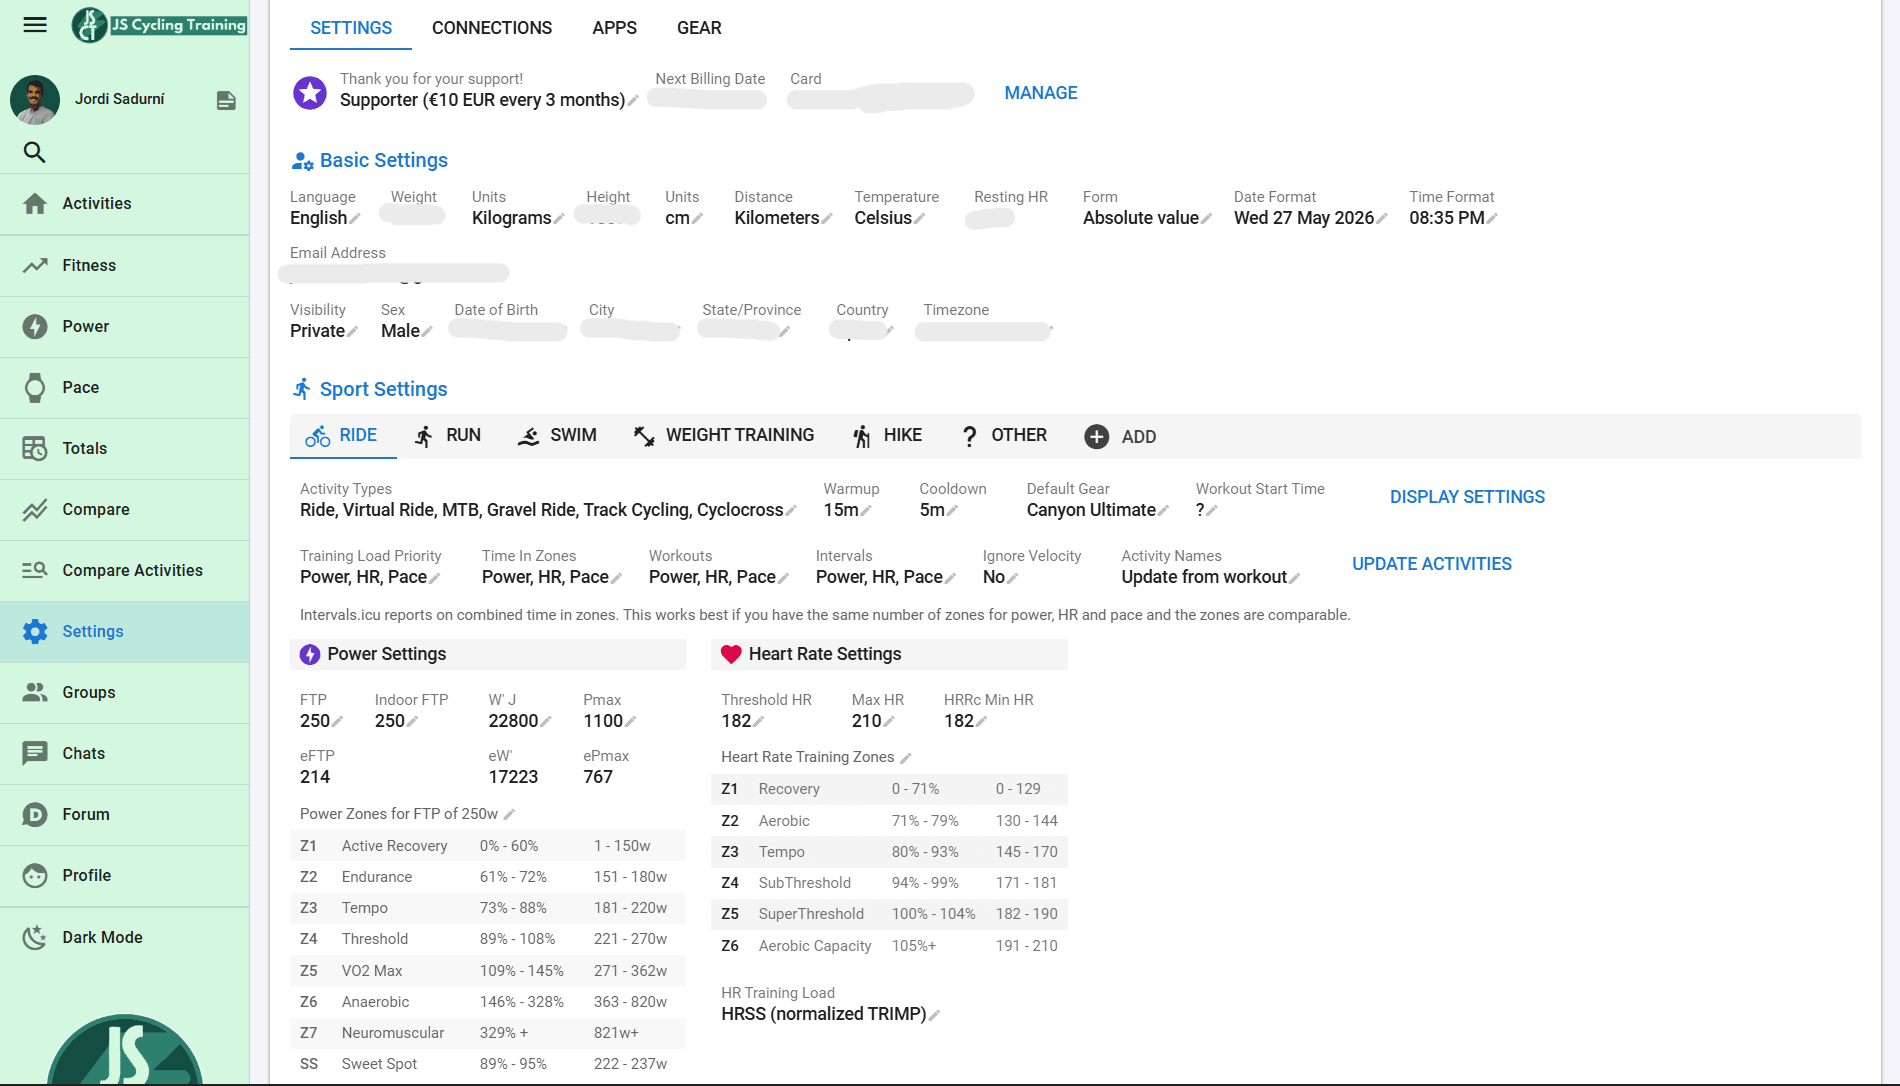
In the basic settings you define language, units, weight, height, date of birth, time zone and date format. Age is used, among other things, to compare you with reference groups. In each sport section —Ride, Run, Swim, Other— you configure FTP, lactate threshold heart rate, maximum heart rate, power zones, heart rate zones and the priority used to calculate training load: power first if you have a power meter, heart rate if you do not.
You can also adjust the minimum duration used for eFTP estimation, default gear and other details. There are more sections worth knowing: gear management, third-party connections, privacy circles, seasons, wellness fields and developer settings, where you will find your athlete ID and API key in case you ever want to use an external app.
You do not need to touch everything on day one. But FTP, zones and heart rate values are essential if you want the platform to make sense. You should also update them whenever a test, a good run of training or a clear change in level suggests that they no longer represent your current state.
Connections: how to sync devices and wellness
In Settings, the Connections tab brings together direct integrations: Garmin, Wahoo, COROS, Suunto, Polar, Strava, Zwift, Amazfit, Huawei, Concept2 and other platforms. Each one is connected by authorising access from its own box. Activities are imported automatically and, if you have two connected services uploading the same ride, the copy from the direct device source —for example, Garmin— takes priority over the Strava copy to avoid duplicates.
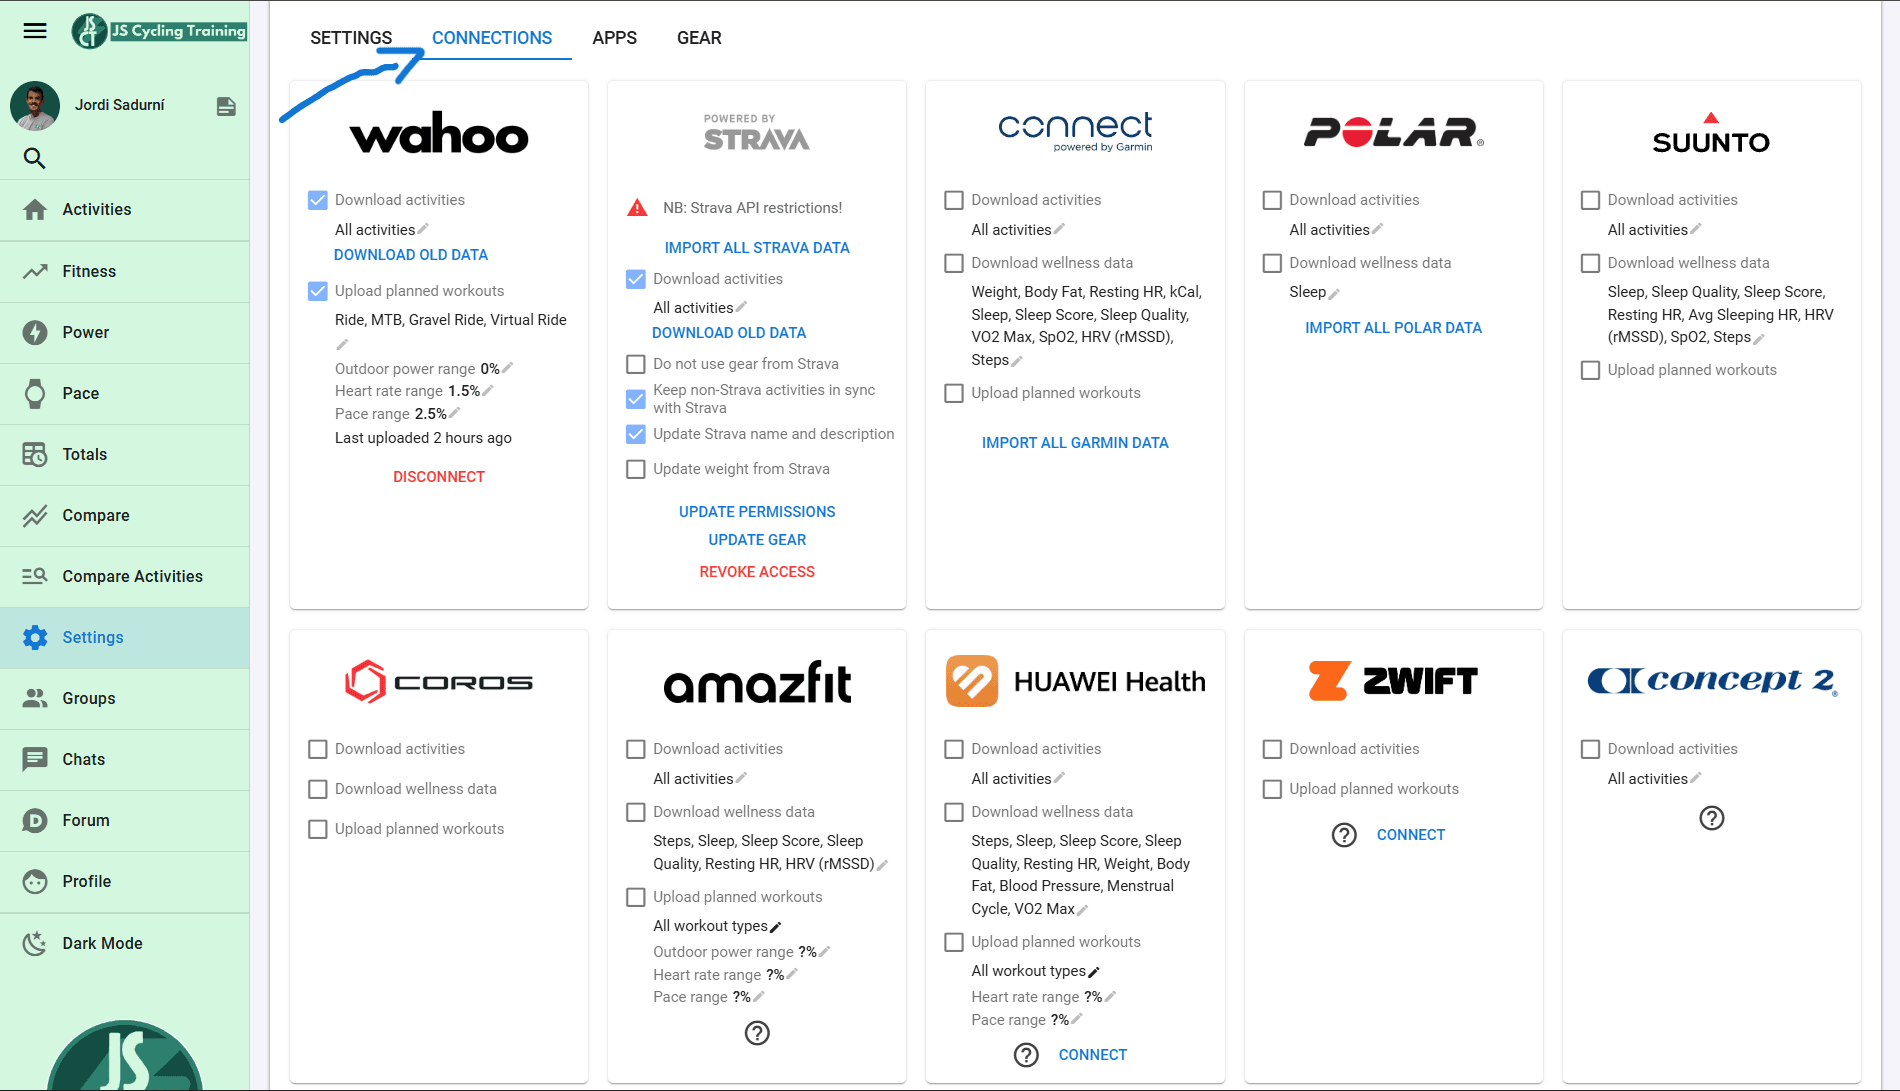
Wellness data —sleep, resting heart rate, HRV, weight, SpO₂, menstrual cycle and more— can sync from Garmin, Polar, Suunto, COROS, Huawei, Amazfit, Oura or WHOOP. Apple Watch needs a third-party bridge such as HealthFit because Intervals.icu does not have its own official app for that integration.
There is an important nuance here. Strava limits what external platforms can do with its data. Downloading your full historical data from Strava is reserved for Supporters, while syncing new activities remains free. In addition, activities that arrive via Strava cannot be shown to your followers inside Intervals.icu —your coach can still see them— and they are deleted if you disconnect Strava.
The practical conclusion is simple: connect your bike computer or watch directly whenever you can and leave Strava as a backup. With Garmin, for example, you can import your full history for free and with fewer restrictions.
If you want to receive planned workouts on your device, activate the option to upload planned workouts in the relevant integration. Intervals.icu automatically pushes the upcoming sessions and sends them again whenever you change something. It works with Garmin, COROS, Wahoo, Suunto, Zwift and some Amazfit models. Polar and Apple Watch, because of platform limitations, can send completed activities but cannot receive planned workouts from Intervals.icu.
Inside the calendar
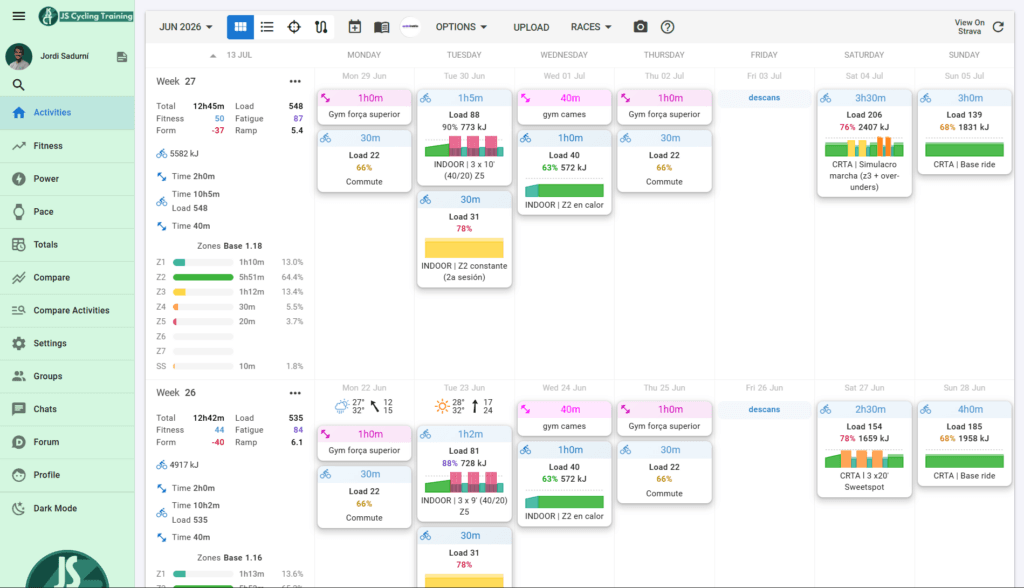
The calendar is your operations centre. By default, you see it in weekly view, with completed activities and planned sessions. In the top bar you can change month or year, switch between calendar and list view, add workouts, enter wellness data, create notes, mark races as A, B or C goals, define seasons, record illness or injury, open your workout library and export data.
Each weekly row summarises the key information: training load, Fitness, Fatigue, Form, rate of increase in fitness —Ramp—, calories, elevation gain and goals by sport with their completion percentage. It even classifies weekly intensity distribution as polarised, pyramidal, threshold-based or other categories.
When you plan a session and then complete it, you can see planned and actual side by side, with a green, orange or red indicator depending on how far you deviated from the plan. The list view also allows bulk editing: changing weight across a date range, correcting FTP, re-detecting intervals or reprocessing files. This is especially useful when you import old data and need to fix several records at once.
Create and plan workouts
To plan a session, click on a day, choose the sport and describe the workout. The interesting part is that the builder understands plain text: you can write the session directly and the platform interprets it. The pattern is simple: duration or distance followed by the target, for example “10m 65%” or “4x 5m 105%, 5m 50%”.
Targets can be expressed as a percentage of FTP, a zone, absolute watts, heart rate —marked with HR or LTHR— or pace. You can also add cadence and step types for repetitions, ramps, warm-up, cool-down or free effort. If you prefer not to type, there is an assistant with buttons to add steps.
An example of a power-based structured workout could look like this:
Warm up
- 20m Z2

Z5 intervals:
4x
- 5m 110-115%
- 4m z1

Complete in Z2
- 64m Z2
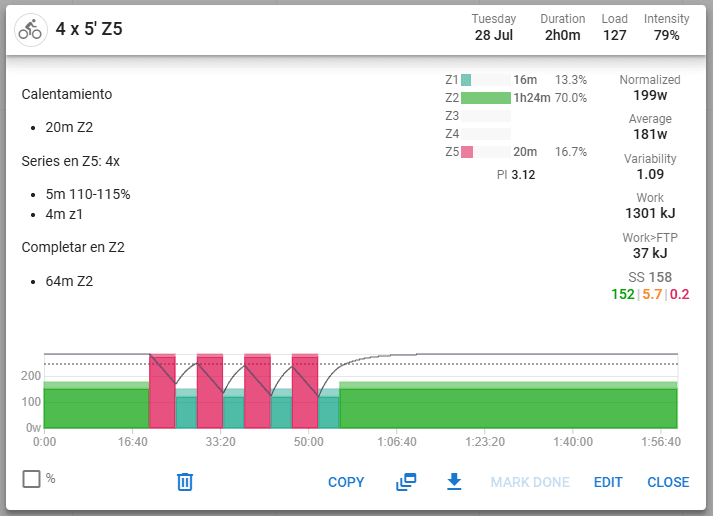
When you save it, Intervals.icu calculates duration, load, intensity factor, normalised power, work in kilojoules and time in each zone. It also draws the workout profile. You can copy it, save it to your library, drag it to other days or sync it to your device if the integration allows it.
The Fitness page: Fitness, Fatigue and Form
The Fitness page is the long-term evolution chart, what has traditionally been called a PMC. It combines three lines. Fitness represents accumulated condition, a weighted average of training load over the last few weeks. Fatigue responds faster and reflects recent load. Form is the difference between Fitness and Fatigue, and helps estimate whether you are fresh, in a productive zone or entering risk.
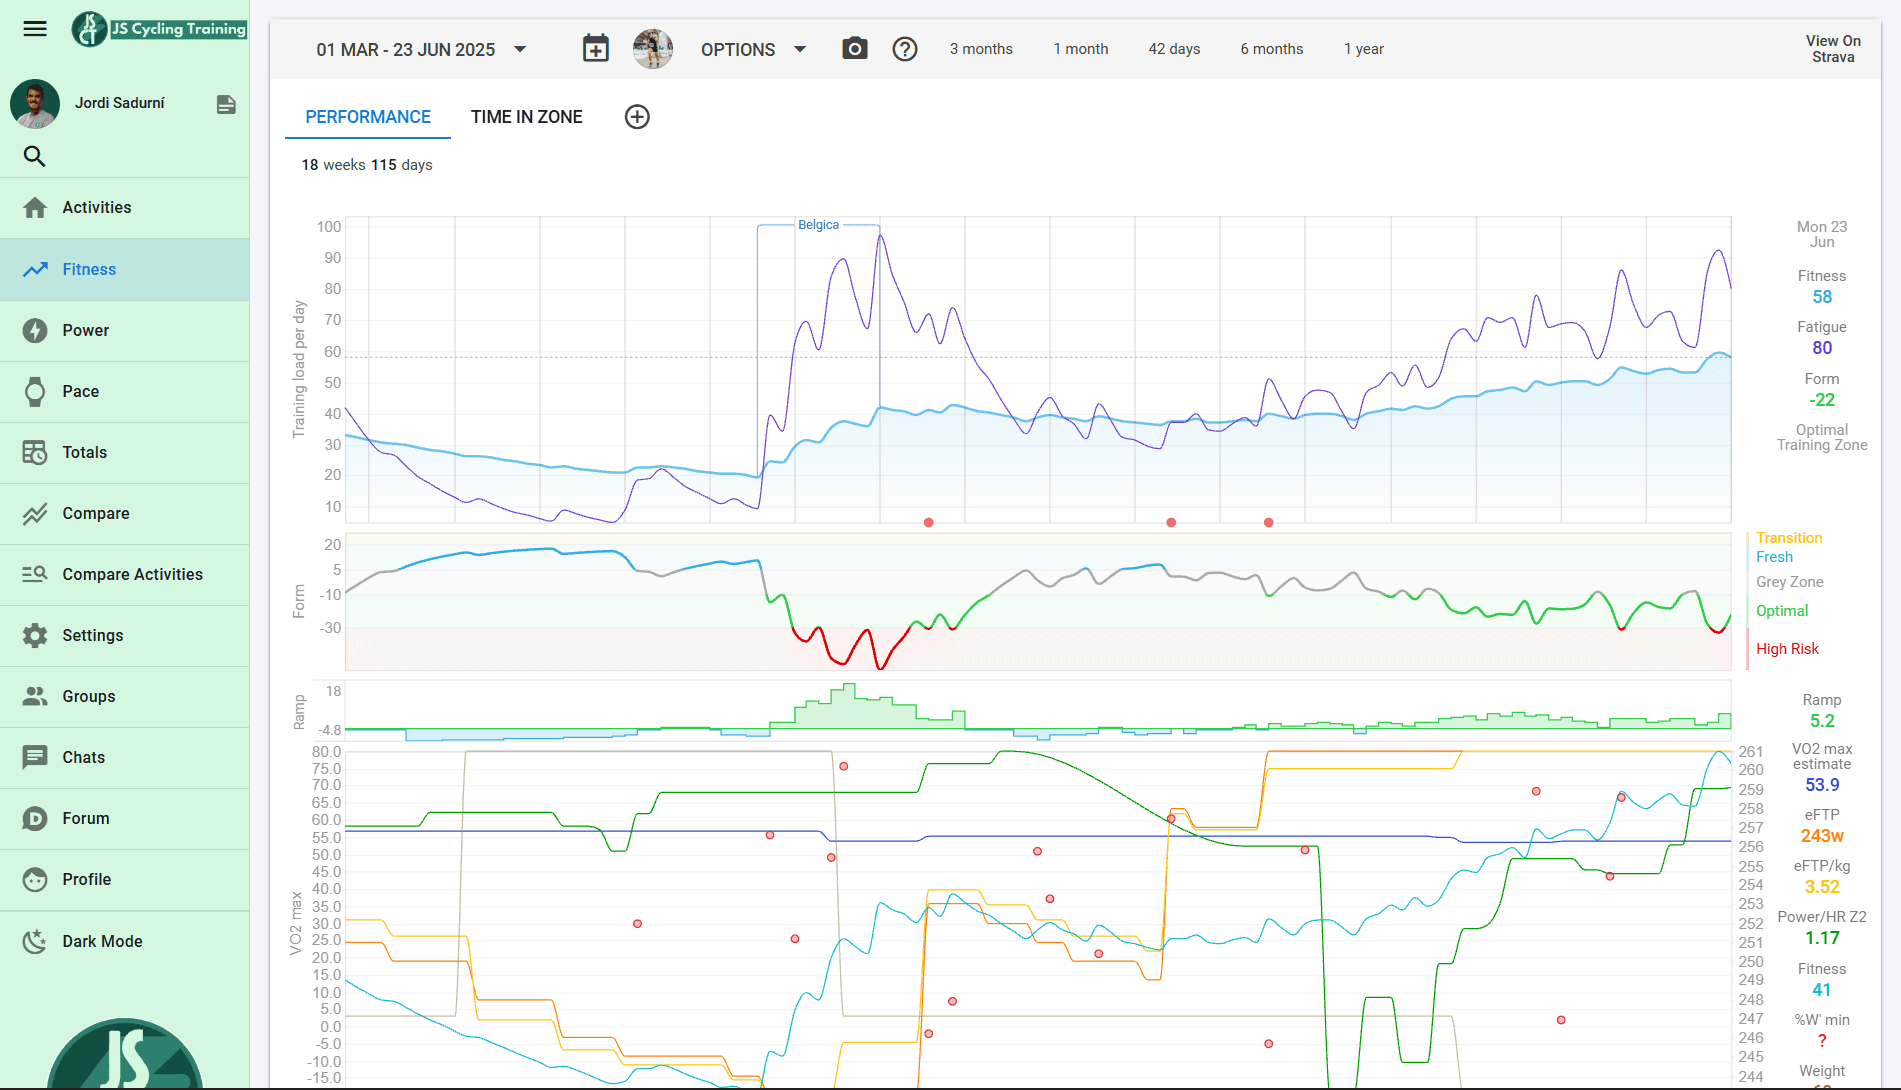
Form comes with colour bands that are worth learning to read. At very high values you are in transition, usually because of inactivity. At slightly positive values you are fresh, a good state for racing if you have tapered well. At moderately negative values you are training with load. If you drop too far, you enter a risk zone where fatigue can start to interfere with adaptation.
One note for the first few days: if you do not import your history, Fitness will start at zero and Form may misleadingly show high risk for a few weeks. You can set an initial Fitness and Fatigue value in the settings or import old activities so the chart is more realistic from the beginning.
This page also supports custom charts. As with activities, you can create your own or search among those shared by the community and add them so you can see exactly what you need.
The Power page: power curve and eFTP
The Power page shows your mean maximal power curve: the best watts you have sustained for each duration, from one second to several hours, both in absolute watts and watts per kilo. You can view it by season and compare it with previous periods to detect real improvements, loss of form or gaps in your profile.
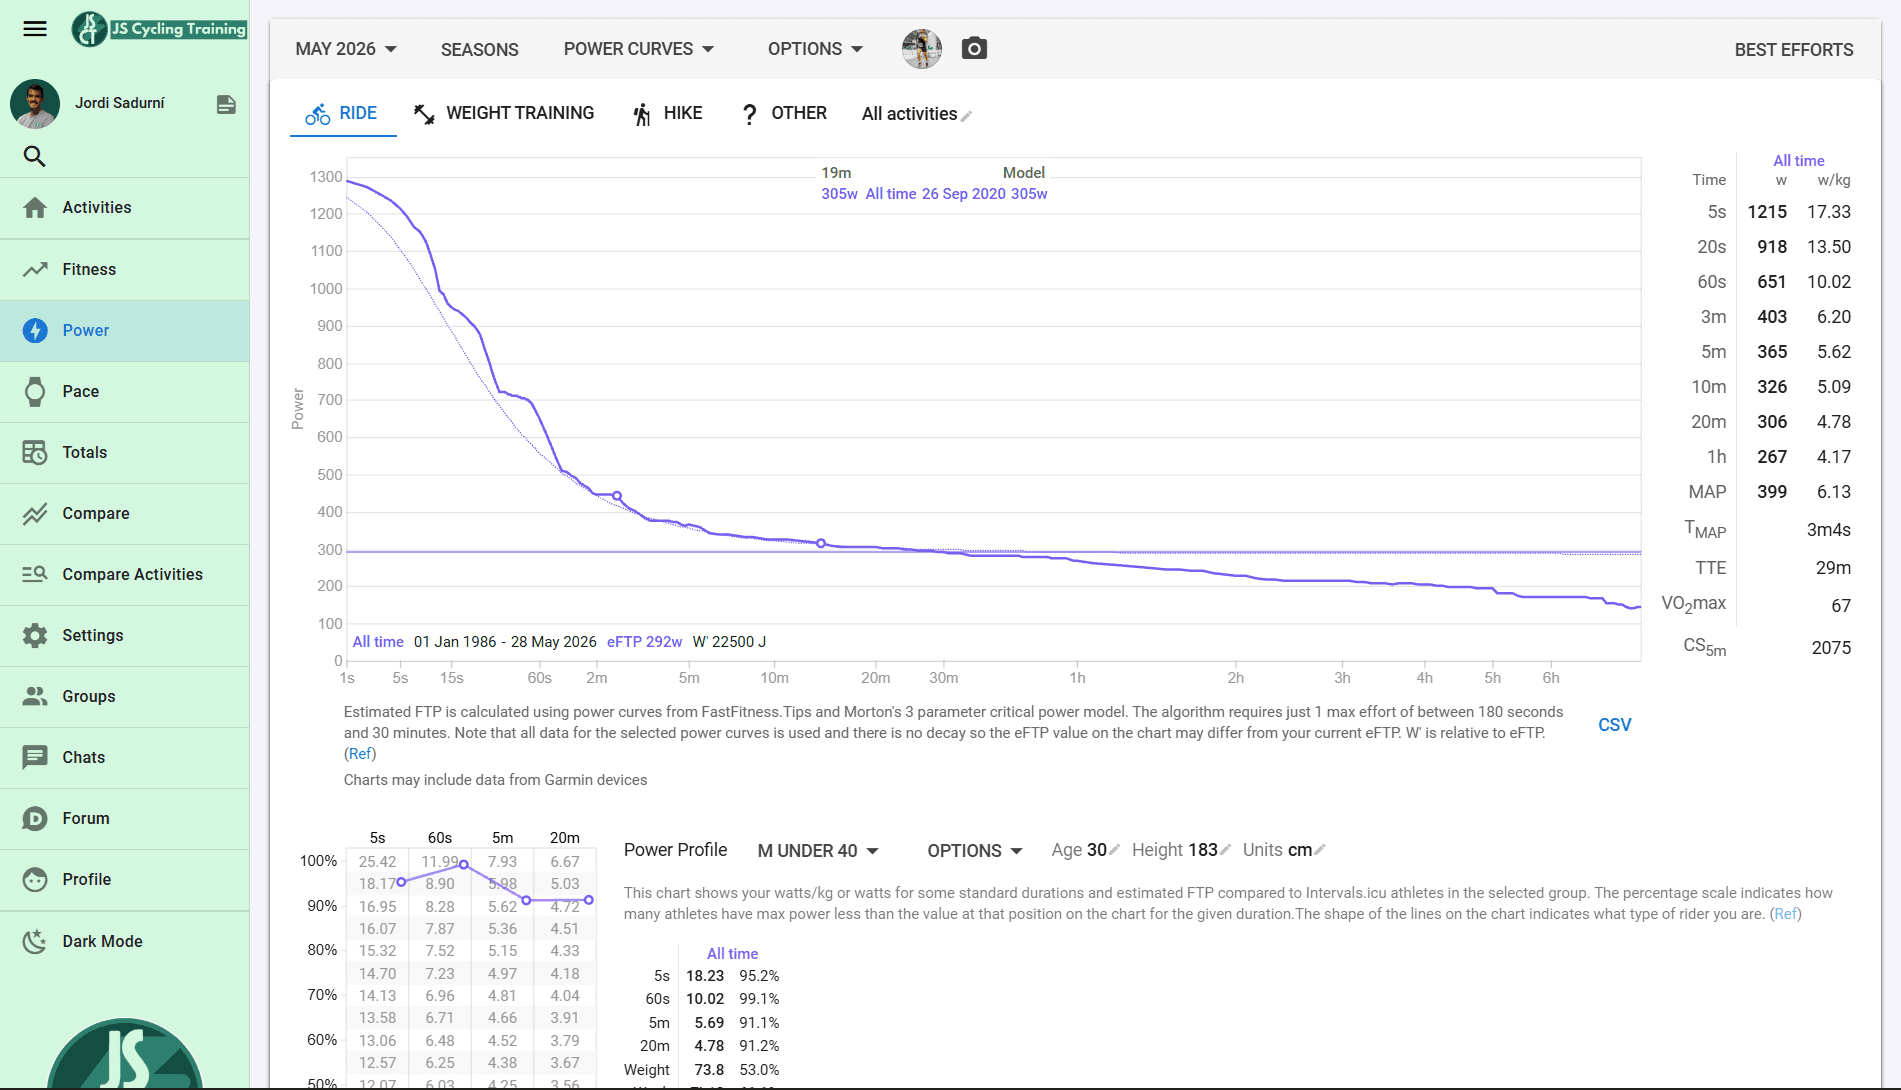
From your best efforts, Intervals.icu estimates your FTP —eFTP— and, using critical power models, your CP and W’. It also calculates MAP and time to exhaustion. The most visual part is the power profile compared with reference tables by sex and age, which helps place your values in context without turning a single number into an exaggerated conclusion.
This page is especially useful for understanding what type of cyclist you are and what limits you. You can see whether your profile stands out more in short efforts, around 5 minutes, at threshold or in longer durations. That reading helps decide whether it makes more sense to work on VO₂max, threshold, fatigue resistance, sprint, strength or simply more aerobic base.
Wellness: weight, sleep, HRV and why it matters
The wellness section records day-by-day data such as weight, calories, resting heart rate, sleep duration and quality, HRV, SpO₂, blood pressure, body fat percentage or VO₂max, as well as subjective scales for fatigue, muscle soreness, stress, mood or motivation.
This is not filler. The load you apply only becomes adaptation if recovery supports it. Signals such as several days of elevated resting heart rate, clearly lower HRV, poor sleep or very low motivation help distinguish between one bad day and a trend that deserves attention.
The value is not in obeying one isolated metric. It is in reading the whole picture. If power drops, heart rate behaves strangely and sleep has been poor for three nights, maybe you are not simply “weak”: maybe you need to adjust load. If recovery data and perception are both good, you probably have room to maintain or progress training.
Analyse an activity
When you open an activity, you see power, heart rate, cadence, pace and altitude series, together with an automatic interval analysis. Intervals.icu detects efforts on its own or uses the laps in the file, and gives you a table for each interval with more than twenty variables: average power, normalised power, heart rate, cadence, variability, work, intensity, efficiency and more.
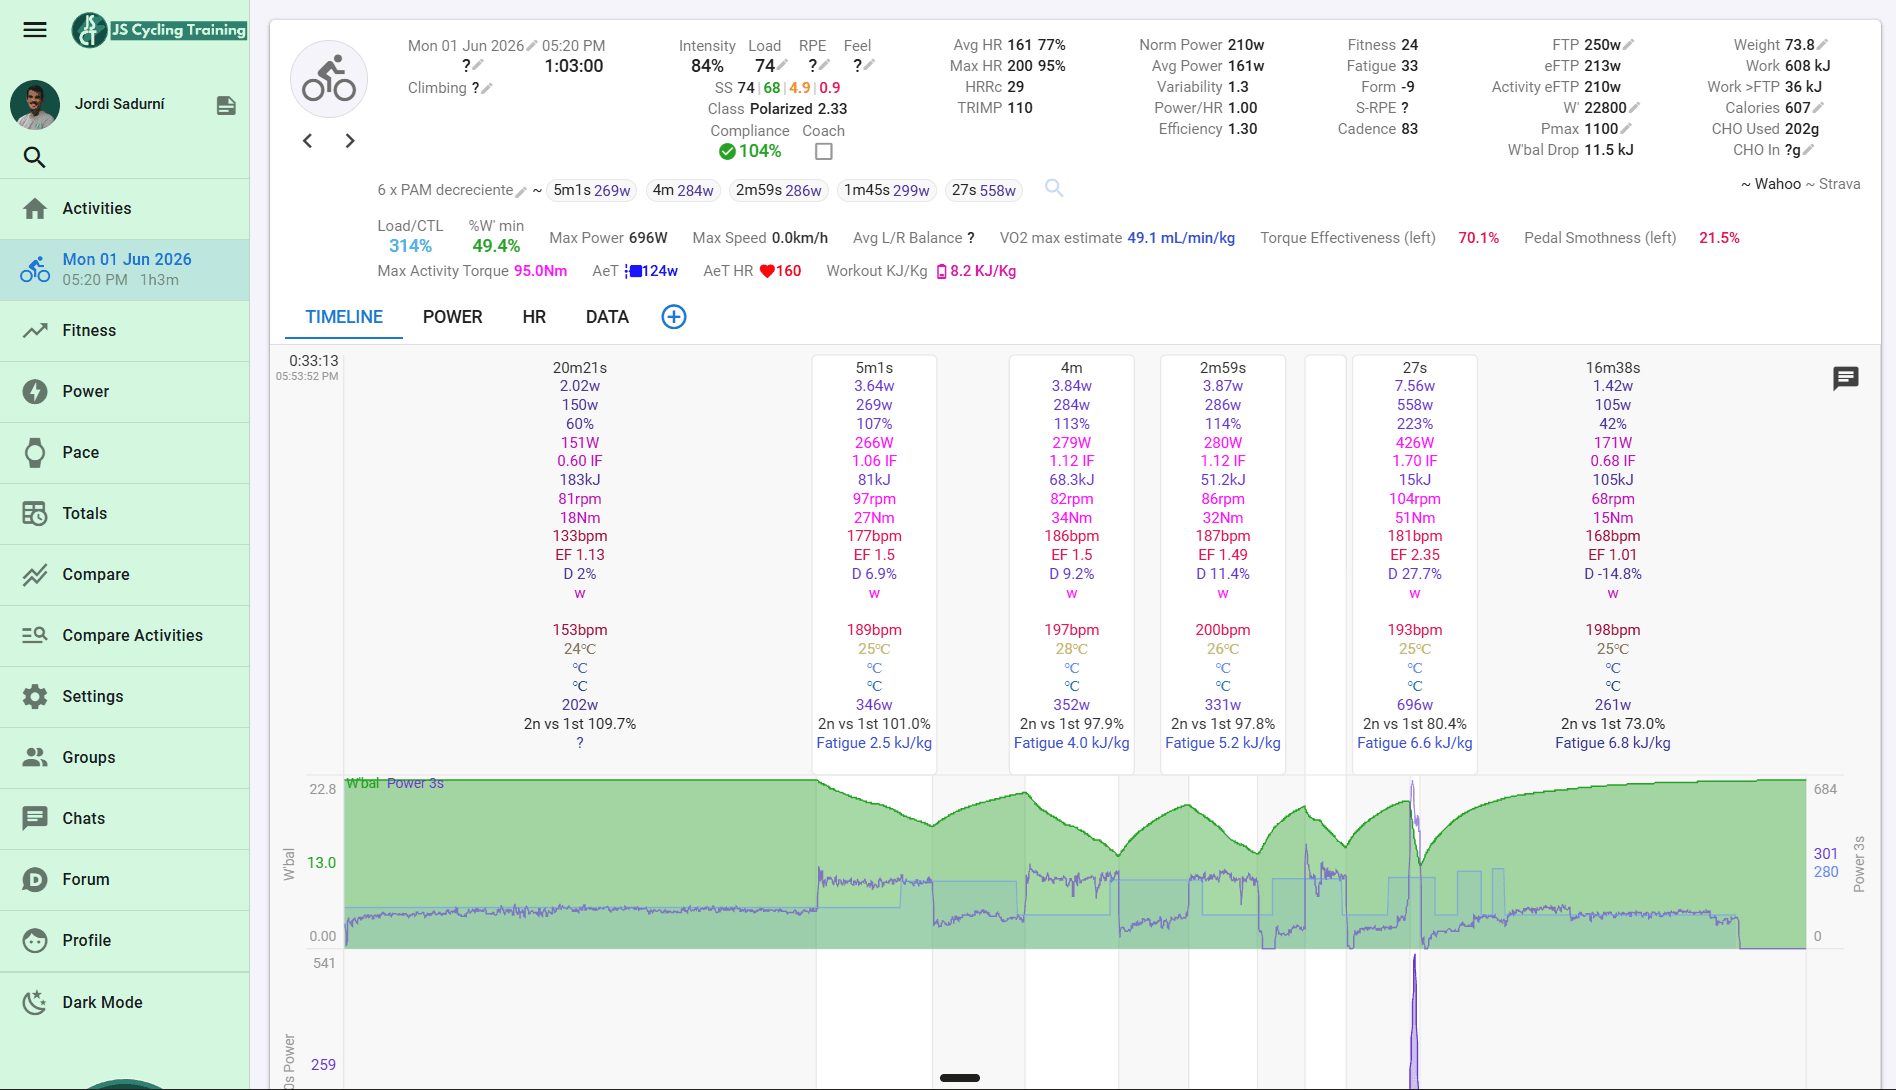
One especially useful metric is the decoupling between power and heart rate, or Power/HR. It measures cardiac drift in zone 2 sections: if heart rate rises while power stays stable, it may be a sign of fatigue, heat, dehydration or insufficient aerobic base. This is very practical for assessing efficiency in long efforts.
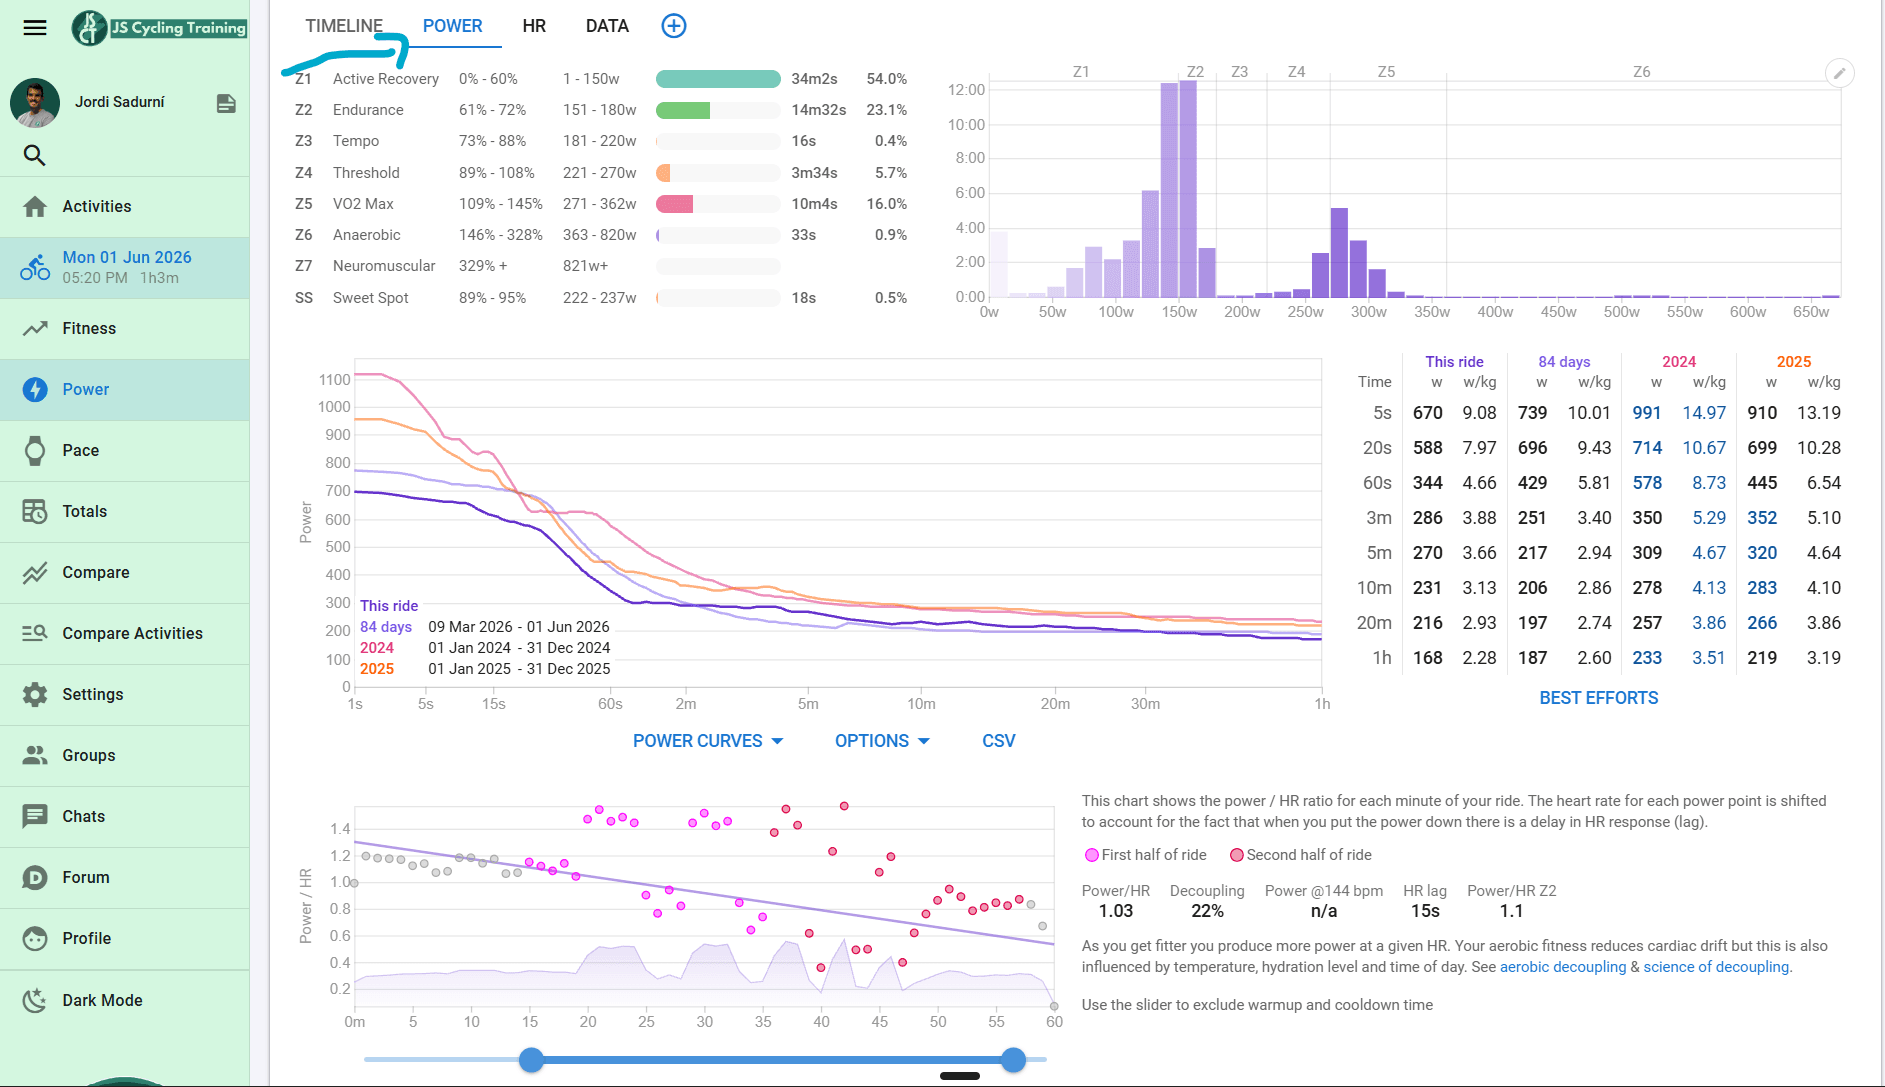
In this tab you can also add more charts to analyse intervals in detail. At the bottom of the page there is a button to add charts, with many options created by the community. You can also overlay the route map with historical weather for that day, which helps interpret a poor data point when there was heat, wind or unusual conditions.
This is where the customisable side appears again. Under the activity chart you have the Custom tab, where you can search for and add summary metrics that are not included by default. For example, you can create fields related to decoupling by zones, efficiency, time in specific ranges, intensity distribution or any metric that makes sense for your way of analysing.
The good thing is that you do not have to create everything from scratch. When you add a field or a chart, you can search among those made public by other users and add them to your account with one click. It is the fastest way to get advanced metrics without starting by coding.
Compare activities
The compare function lets you overlay two or more rides. It is useful for seeing the progression of the same interval session over several weeks, comparing training blocks or contrasting your ride with another athlete’s.
It is especially useful when you have repeated routes, similar tests or key sessions that reappear within a block. Instead of only looking at whether you produced more watts, you can see how heart rate, cadence, cardiac drift, effort distribution or your ability to finish the session changed.
Working with a coach
If you work with a coach, Intervals.icu can become your shared workspace. The athlete starts the process: in the Athletes section there is an Add a coach button, where you search for the coach’s name and send a request. Once accepted, the coach can see your calendar, activities, wellness data, metrics and comments.
This is exactly what separates a generic plan from real follow-up. With access to your data, a coach is not sending sessions blindly. They interpret how you respond to load, adjust based on what power, heart rate and your sensations show, and replan when reality deviates from the script.
Other useful tools
There are more functions you will discover with use. The Pace page does something similar to the Power page, but with pace, mainly for running. Totals summarises your volumes by sport over any date range. Gear management tracks mileage for bikes, wheels, chains or shoes and warns you when maintenance is due.
You can also create seasons, mark goals, manage privacy through circles, build a workout library and review aggregated statistics by sport or period. You do not need to master everything on day one, but it is worth knowing these options exist so you can add them when they provide value.
One important detail: there is no official mobile app. The website works well on mobile because it is responsive. If you use it from your phone, you can open Intervals.icu in the browser and add it to your home screen. In practice it behaves almost like an app, although it is still the web version.
What is free and what is paid
To make it clear and avoid surprises: almost everything a cyclist needs is in the free version. Fitness, Form, power curve, eFTP, wellness, calendar, workout builder, sending sessions to compatible devices, activity analysis and comparisons are available without paying.
The Supporter subscription, around 4 USD per month, unlocks specific extras: advanced weather analysis, annual plan builder, full Strava history download, fully customised zones, team and organisation management for coaches, more personalisation options and some secondary features.
The practical reading is that you can train very seriously with the free version. If you use it a lot, if you are a coach or if you want to support the development of the platform, the Supporter subscription makes sense. But you do not need to pay to check whether Intervals.icu fits your needs.
Conclusion
Intervals.icu does not train for you and it does not decide for you. What it does is organise your data so decisions —yours or your coach’s— are made with information rather than guesswork. Start with the essentials: create the account, set FTP, zones and connections correctly, import your history if you can, and learn to read the calendar, Fitness, Power and activities.
From there, the value lies in judgement. The platform gives you data, charts and possibilities. Training improves when that information becomes decisions: what load to apply, when to recover, which capacity to prioritise and which signals should not be ignored. That is where Intervals.icu can be a powerful tool for road, MTB and gravel cyclists, or any endurance athlete who wants to train with greater precision.