Table of Contents
- 1. Why are watts important in cycling?
- 2. Average power in different groups of cyclists
- 3. How to Perform a 20-Minute Test to Calculate Your W/kg
- 4. Other Factors to Consider Beyond W/kg in 20 Minutes
- Conclusion
- Bibliography
1. Why are watts important in cycling?
In cycling, when we talk about watts, we are referring to the amount of power or work performed by the cyclist on the pedals per unit of time, expressed in watts (W). This power results from the force applied on each pedal stroke and the cadence at which you pedal. The higher the power generated, the greater the cyclist’s speed, as long as the position on the bike remains unchanged. When evaluating/estimating climbing performance, relative power to body weight (W/kg) is usually used; for flat terrain, especially in time trials, the focus is more on power relative to frontal area or aerodynamic drag coefficient (W/CdA). In this article, we’ll discuss how many watts does a professional cyclist produce, the typical power outputs in different categories for both men and women, and the values seen in amateur events like the Quebrantahuesos. If you want to learn more about cycling power and the factors it depends on, take a look at this other article.
2. Average power in different groups of cyclists
Below, we present an overview of the power values found in different types of road cyclists according to their category and level.
2.1. Amateur Cyclists in Endurance Events (Quebrantahuesos)
Cyclists who take part in endurance events like the Quebrantahuesos (QH) in Spain, which covers about 200 km and lasts between 5 and 8 hours, show quite heterogeneous power outputs due to the wide range of fitness levels. These values can fluctuate depending on resistance to fatigue, prior preparation, and hydration/nutrition during the event, but here are some estimates and a couple of real-world examples of this particular race. This is a good benchmark since it’s the most pupular sportive in Spain an is a very competitive race, so it’s a great race to be able to know the standards for watts per kilo for amateur cyclists:
- Ex-professional cyclists (under 5.5h): Maintain average power between 3.5 and 4 W/kg, climbing at 4.5–5 W/kg.
- Advanced amateur cyclists (5.5–6h): Maintain average power between 3 and 3.5 W/kg, climbing at 4–4.5 W/kg.
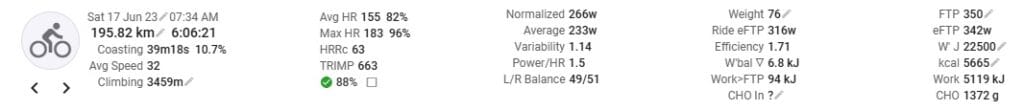
Example of one of our cyclists: total time 6:06h, average power 233W, normalized power 266W NP, body weight 76kg. Average power: 3.07 W/kg (3.5 W/kg NP). Climbing at 3.4–4.3 W/kg average.
- Intermediate amateur cyclists (6–7h): Typically fall in the 2.5–3 W/kg range, climbing at 3.25–3.75 W/kg.
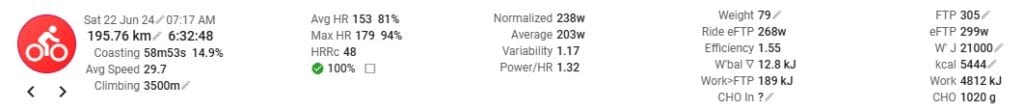
Another example from our group, with a similar weight (77kg): total time 6:32h, average power 203W, normalized power 238W NP. Average watts: 2.63 W/kg (3.1 W/kg NP). Climbing at 2.8–3.4 W/kg average.
- Beginner amateur cyclists (7–8h or more): Average power is usually below 2 W/kg, climbing at 2–2.8 W/kg.
You can find more examples of cyclists who have completed the QH and the watts they push in this article by Sebastián Sitko.
2.2. Under-23 Cyclists
In the U23 category, young cyclists train systematically to compete, but their power production is still developing:
- Men: Range from 4.5 to 6 W/kg for sustained efforts (e.g., a 20-minute time trial). According to RFEC (spanish cycling federation) data, U23 cyclists need to achieve an average of 5.8 W/kg over 20 minutes to be competitive. To stand out or progress to the professional level, the target is 6.1 W/kg for that interval, which is above the 90th percentile.
- Women: Their values range from 4 to 5 W/kg in the same tests.
At this age, performance depends greatly on previous training level and genetic factors, with some cyclists already training up to 20 hours per week and reaching power outputs close to professional levels. However, most riders in this category still have room for improvement.
2.3. Continental and Pro-Continental Cyclists
Continental and pro-continental cyclists have high performance, but not quite at the World Tour level.
- Men: 20-minute power ranges from 5.5 to 6.2 W/kg.
- Women: On average, between 4.5 and 5.5 W/kg.
These cyclists can sustain high power for extended periods, especially in climbs of more than 10 minutes and time trials, where anaerobic capacity and power profile are decisive for success.
2.4. World Tour Cyclists and the Best Cyclists in the World
World Tour cyclists are the ultimate example of performance in cycling, capable of sustaining extreme power outputs under all kinds of conditions:
- Men (elite): Sustained average power over 20 minutes ranges from 5.8 to 6.7 W/kg, with the very best in the world (like Pogacar and Vingegaard) even approaching 7 W/kg.
- Women (elite): Values range between 5 and 6 W/kg, with some exceptions slightly exceeding this (such as Demi Vollering).
At this level, beyond just raw power production, fatigue resistance is fundamental. These cyclists can maintain high power outputs during stages of more than four hours, day after day. The combination of a very high VO2max, optimized anthropometry, and outstanding adaptation to exertion allows them to perform at the highest level under the most demanding conditions.
2.5. World Records According to Coggan
Andy Coggan popularized a table describing the power profile: the maximal power values for 5 seconds, 1 minute, 5 minutes, and 20 minutes. Below you can see the table in W/kg for each time range, according to sex and rider level. The top row would correspond to the best cyclists in the world. For example, maximum values of 11.5 W/kg for 1 minute and 7.6 W/kg for 5 minutes might be similar to what Mathieu Van der Poel or Wout Van Aert can produce, while FTP values of 6.4 W/kg are only within reach of Tour de France podium finishers (Pogacar, Vingegaard, Evenepoel, etc.).

2.6. Differences Between Men and Women
In general, men tend to produce higher absolute power than women, mainly due to differences in muscle mass and body composition. However, when power is adjusted for body weight (W/kg), these differences become smaller, especially in advanced categories.
Looking at Coggan’s power profile, we see that the best male records are 23.8%, 23.8%, 15%, and 12.4% higher than the best female records for the 5s, 1min, 5min, and 20min tests, respectively. This means that men generate somewhat more watts under aerobic conditions (from 5 minutes onward), but above all, produce significantly more watts in efforts under 5 minutes, where the anaerobic system predominates. Therefore, men have a more explosive profile, while women have a more endurance-based profile, which aligns with the scientific literature indicating that women have a higher proportion of slow-twitch fibers and greater resistance to fatigue, but less strength (per unit of muscle mass).
3. How to Perform a 20-Minute Test to Calculate Your W/kg
For the QH, we discussed submaximal watts (which can be maintained continuously for several hours), but in the previous examples of professional cyclists, we referred to maximum 20-minute watt values. So, how is this measured?
The 20-minute test is a key tool for assessing cycling performance, as it allows you to calculate both your watts per kilo (W/kg) and your Functional Threshold Power (FTP). It’s a simple and direct method, but to obtain accurate results, it’s essential to follow a well-structured protocol. Also, to compare your results over time, it’s best to always do the test on the same climb and under the same conditions for consistency.
Before doing the test, make sure you have properly rested in the days prior, avoiding intense efforts that could compromise your performance. Nutrition is also important: ensure you consume enough carbohydrates and stay well-hydrated. Try to perform the test in a controlled environment, ideally on a steady climb without interruptions, and always use the same equipment you use in training to ensure data consistency.
Test Protocol
- Warm-up: Do 20–30 minutes of progressive warm-up. Include 2–3 short sprints or a progressive effort to properly activate your cardiovascular system.
- Test: Maintain a constant effort for the 20 minutes, aiming for the highest average you can sustain without fading. Use a controlled pace and don’t go out too hard at the start to avoid premature fatigue. A tip I always give is to try to negative split the test: for example, if you can hold 300 W for 20 minutes, do the first 10 minutes at 290–295 W and the last 10 at 305–310 W.
- Monitoring: In addition to power data, make sure to also wear a heart rate sensor to get more data and analyze your effort more thoroughly afterward. You can also use your heart rate to pace yourself if you’re unsure how many watts you can sustain for 20 minutes. In this case, your heart rate should gradually rise from minute 3–4 of the test until the end, reaching Z4 at minutes 3–4 and ending the last minutes in Z5.
- Cool-down: After finishing the test, it’s advisable to ride for 10–15 minutes at low intensity to recover properly.
Once you’ve finished the test, check your average power in watts over those 20 minutes. Divide this value by your body weight in kilograms to get your W/kg. For example, if you averaged 280 W and weigh 70 kg, your result would be 4 W/kg.
If you also want to calculate your Functional Threshold Power (FTP), multiply your average power by 0.95 (95%). This will give you an estimate of the power you could sustain for a full hour at maximum effort, which is useful for defining your training zones. Since you haven’t followed Coggan’s protocol exactly, some authors recommend multiplying the 20-minute value by 0.93–0.91 for a more accurate FTP estimate. Multiplying by 0.91 will likely get you closer to your MLSS (maximal lactate steady state) than multiplying by 0.95.
This test not only helps you measure your current level but also allows you to compare your progress over time and fine-tune your training more precisely.
4. Other Factors to Consider Beyond W/kg in 20 Minutes
4.1. Examples of Power Profiles by Effort Duration
On intervals.icu, for example, you don’t even need to do a 20-minute test—you can use the estimated power curve (eFTP), as long as you’ve done a recent maximal effort. You can also compare your power profile to Coggan’s charts and the intervals data for your population group.
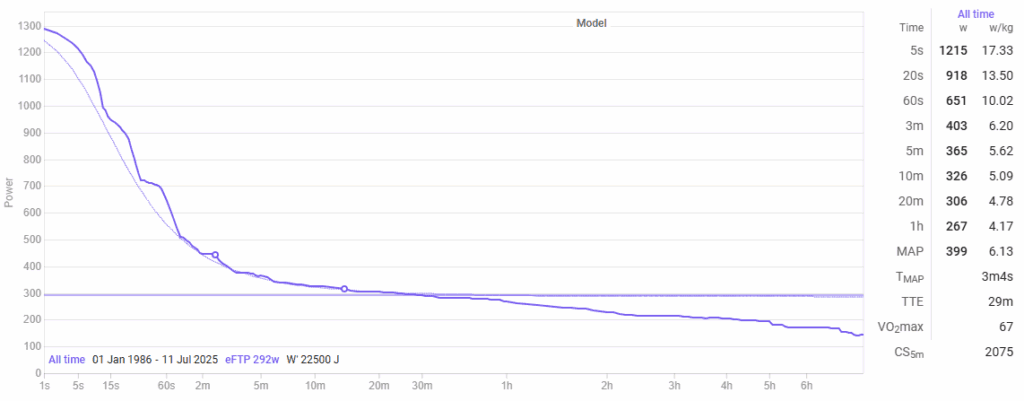
Up to now we’ve discussed average powers in races and peak power values for 5s, 1min, 5min, and 20min, but that’s not all. There are other very important parameters depending on the discipline, which can be assessed with the power curve. The power profile is useful for its simplicity and measures peak power values at: 5 seconds (maximal anaerobic power), 1 minute (anaerobic capacity), 5 minutes (VO2max power), and 20 minutes (FTP).
For example, even if a road cyclist has a better 20-minute power and is equally skilled technically as an MTB (XCO) rider, the XCO rider will probably have better 1- and 5-minute power values, and thus would win in an XCO race—since for that discipline, strong 1- and 5-minute values are more important than a strong 20-minute value. Another example would be a sprinter: for sprinters, it’s crucial to have excellent relative power in the 5–15 second range and a good 1-minute power, but they usually have the lowest relative 20-minute power in the professional peloton.For more details on this, check out this other article.
4.2. Importance of Body Composition in Relative Power (W/kg)
As mentioned in the introduction, the power-to-weight ratio (W/kg) is crucial when climbing, where performance depends directly on body weight. An optimized body composition—with a low body fat percentage and adequate muscle mass—maximizes this ratio. On the other hand, in time trials (TT), CdA (frontal aerodynamic drag coefficient) becomes much more important, as reducing wind resistance increases speed without needing to generate more power. Adjusting both weight and aerodynamics is key to excelling in both disciplines. For example, you can climb faster by losing some weight, and go faster on the flat by optimizing your CdA, without having to push more watts.
4.3. Absolute vs. Relative Power Depending on Terrain
In cycling, the terrain determines which type of power is most relevant. On flat terrain, heavier cyclists tend to excel thanks to their higher absolute power, which allows them to overcome aerodynamic resistance. In contrast, on climbs where gravity is the main challenge, lighter cyclists stand out due to a better W/kg ratio.
For example, consider an 80kg cyclist versus a 60kg cyclist: while a climber (60kg) could reach 6 W/kg on long ascents, a rouleur of similar level (80kg) would only reach around 5.6 W/kg. On the flat, however, the rouleur could sustain 450 W in prolonged efforts, while the climber would only be able to hold about 360 W.
In the study by Lambaerts et al. (2012), they found a stronger correlation between time trial performance and the ratio W/(kg^0.32). Therefore, W/kg can be used to assess climbing performance, and W/(kg^0.32) for flat or time trial performance.
Another interesting metric is the Compound Score from Leo, P. et al. (2022). Here, the authors sought a metric that correlates better with road race performance and proposed W²/kg. In this study, the Compound Score is calculated using the 5-minute maximum power.
4.4. Fatigue Resistance and Consistent Power Output in Long Events
Fatigue resistance is crucial in long-duration events. Some cyclists can maintain power outputs close to their threshold even after several hours of effort, thanks to specific training that improves aerobic capacity and muscular endurance. Methods like “fatigue resistance testing,” which assesses power output after a prior workload of kilojoules (energy), help to measure and train this ability. Elite cyclists stand out for their consistency, keeping high paces even in the final moments of stages.
4.5. Additional Factors: Nutrition
Hydration and carbohydrate intake during the race are essential to maintain the ability to generate power in prolonged competitions. Even mild dehydration (1–2% of body weight) can significantly reduce performance. For this reason, it’s essential to drink fluids regularly during the event and rehydrate properly afterwards. Regarding carbohydrate intake, it’s well-demonstrated that intakes of 60, 90, or even 120g/h of carbohydrates improve performance in long-duration events.
Conclusion
The analysis of watts in cycling offers a clear perspective on the capabilities and training level of each cyclist, from amateurs to World Tour champions. The differences between men and women, and among the various categories, reflect not only training, but also genetics, anthropometry, and nutrition. To maximize performance at any level, it is crucial to personalize training, adapt workloads, and periodize according to goals.
Bibliography
RFEC (2023, 18 de maig). “Perfil de potencia en ciclismo: valores de referencia en categorías inferiores.” Real Federación Española de Ciclismo (blog): https://rfec.com/es/smartweb/universo_ciclista/articulo/rfec/326-Perfil-de-potencia-en-ciclismo-valores-de-referencia-en-categorias-inferiores
Sitko, S. (2022, 27 de setembre). “Quebrantahuesos: ¿Qué hace falta para bajar de 8, 7, 6:30 y 6 h?” SitkoTraining (blog): https://sitkotraining.com/quebrantahuesos-que-hace-falta-para-bajar-de-8-7-630-y-6h/
Lamberts, R. P., Swart, J., Noakes, T. D., & Lambert, M. I. (2012). “Allometric scaling of peak power output accurately predicts time trial performance and maximal oxygen consumption in trained cyclists.” British Journal of Sports Medicine, 46(14), 1046-1050.
Leo, P., Spragg, J., Wakefield, J., & Swart, J. (2022). “The Compound Score in elite road cycling.” Journal of Science and Cycling, 11(2), presentat al congrés Science & Cycling 2022, Copenhagen.