Table of Contents
How to assess cycling performance?
Before the rise of powermeters, the usual way of assessing cycling performance was through distance in known uphill segments, testing at the velodrome or evaluating the results obtained in a race compared to the rest of the competitors. When the powermeters arrived on professional cycle ergometers, it was possible to start carrying out evaluations in the laboratory with different types of tests in which there was an objective measurement of performance that had a high reliability. Later these powermeters came to personal bicycles of pro cyclists and today anyone can have one on the bicycle, so where does this leave us in the current situation?
First of all, we must differentiate between laboratory tests and field tests. Laboratory tests are considered the gold standard in evaluating performance since they entail greater control of the conditions of the test in question and are always supervised by qualified personnel. On the other hand, the field tests may or may not be directly supervised, but they are carried out in the usual training place, which tends to present greater variability, but they also turn out to be more specific as they better represent the competition conditions.
Main laboratory tests
Each laboratory test has different protocols, but we will mention below the ones that are currently most validated. All of them carried out with a professional cycle ergometer.
Incremental test with indirect calorimetry:
This test, as the name indicates, presents an increasing intensity and stops when the cyclist reaches exhaustion, ideally around 12-14 minutes. It starts at 50 or 100W and increases the load between 15 and 35W every minute (depending on the level of cyclist). During the course of the test, the cyclist wears a mask that analyzes the composition of the inspired and expired gases and with them VO2 max (maximum oxygen consumption) can be calculated. Apart from the VO2 max, the ventilatory thresholds (VT1 and VT2) are also assessed, which are two points at which a change in the increase in ventilation is experienced in relation to exercise. These are two very important physiological traits in long-distance competitions.
Throughout the course of the test, the power and heart rate data are also recorded, therefore, relevant information is also obtained, such as the situation of the ventilatory thresholds and the VO2 max at a certain heart rate and power. When it comes to evaluating performance, these powers associated with VT1, VT2 and VO2 max, both in a relative sense to the cyclist’s body mass (W/kg) and in an absolute sense (W), are very important to assess the level of a cyclist.
Lactate test (MLSS):
The same incremental protocol of the previous test is used in this case, with the difference that instead of wearing mask, the cyclist will be punctured in the ear at the end of each step or every two (if they are of 1min) where the lactate blood concentration is measured. Once the results are obtained, the load (power) that causes an increase of more than 0.5 mmol of lactate with respect to baseline is assigned to the MLSS (maximum lactate stable state) [1]. The MLSS is the peak lactate concentration point at which a stable state is reached, i.e., the point at which both lactate generation and resynthesis are in equilibrium. Therefore, at powers higher than the MLSS, lactate would begin to accumulate and would end up generating a high condition of acidosis that would lead to stopping the exercise.
Wingate test:
Probably the simplest test to interpret and execute of the three. In which the resistance of the cycle ergometer is adjusted to 7.5% of the subject’s body weight and he must perform a sprint at maximum intensity of 30”. With this test it is possible to assess both the average power of the 30” that can be associated with the anaerobic capacity, the maximum power during 5” that represents the anaerobic power and the fatigue index that is calculated as minimum power / maximum power *100.
Power profile and power curve
As for the field tests, lactate or VO2 max tests can also be carried out, but we will focus on those carried out only with the powermeter.
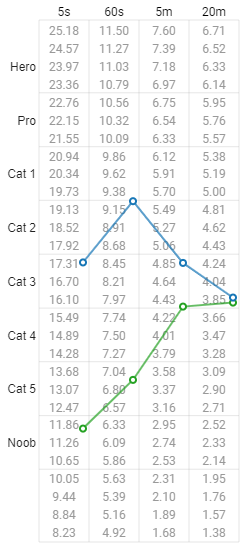
The best option in this case is to look at the power profile. This consists of performing 4 maximum tests of different duration that can be organized in several different ways. The duration of these tests is: 20 minutes, 4 or 5 minutes, 1 minute and 5 seconds. These durations are very relevant since each of them can be associated with different metabolic pathways and physiological traits. Thus, the 20-minute test can be associated with FTP or MLSS, the 4 or 5-minute test can be associated with VO2max, the 1-minute test with anaerobic capacity, and the 5-second test with anaerobic power. Therefore, with the performance of these four tests, a fairly complete assessment of the type of cyclist in question is obtained. For example, comparing the tests with each other, it will be seen that a time trialist only stands out in the 20-minute test, that an all-rounder cyclist has all the tests with decent results whereas a sprinter has a very good 5-second power and 1-minute power.

Power profile. Table obtained from Intervals.icu
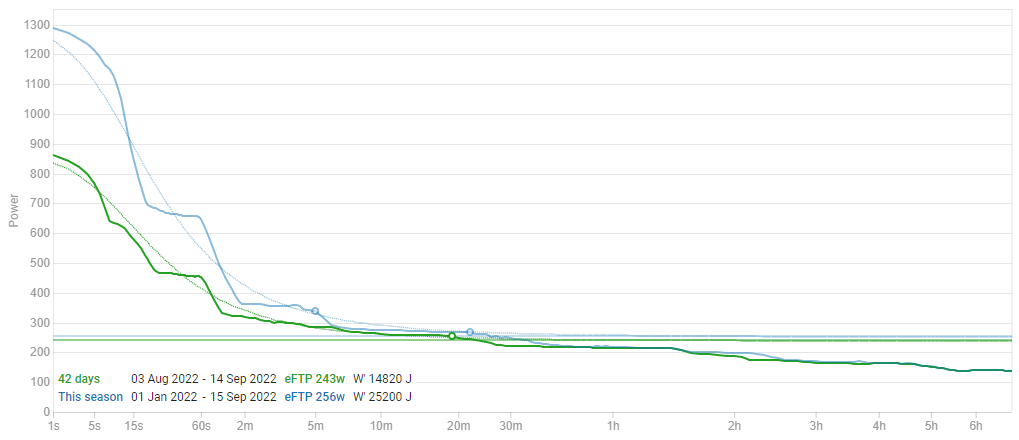
Apart from the evaluation of the power profile, there are also evaluations of the power curve in which all the available time ranges are taken instead of 4 points and an estimate of the real curve of the cyclist is made, that is, for each second. The theoretical power that the cyclist could generate in a maximum test is obtained even if he has not performed it.

There are also other methods such as those for calculating critical power (CP), a metric similar to FTP but which is calculated by studying the relationship of two or three maximum time trials of more than 3 minutes, since the loss of power by lengthening the duration presents a perfectly hyperbolic relationship. With this method, CP is defined as the theoretical power that, given ideal conditions, could be sustained indefinitely over time. And the W’ also appears, which is the amount of energy that can be spent once a power greater than the CP is generated. Therefore, according to this model, whether you are generating a power 20W higher than the CP or if you are 200W higher, the amount of KJ (power*time) will be the same, the difference is that at 200W above the CP you spend energy faster and therefore, it lasts less.
In certain cases, such as road cycling where professional men’s races usually last more than 4 hours, it is also very important to study fatigue resistance. This is done by performing maximum tests, just like with the power profile but having spent x KJ before performing them. For example, it could be riding for 3 hours at a certain intensity and then performing a maximum test (ideally always with a standardized protocol).
And finally, we will talk about the Compound Score (CS) [2]. This is a metric created by the authors of the cited study in which they observed that comparing a relative power metric multiplied by an absolute power metric gave a greater prediction of success in elite races than the two separately. This quotient was called the Compound Score. In the case of the study, they evaluated the power of 5 minutes (P5) and the calculation is CS = P5/kg * P5. This metric can be adjusted to other power ranges that may be relevant for each case.
Bibliography
[1] Pallarés et al. (2016). Validity and Reliability of Ventilatory and Blood Lactate Thresholds in Well-Trained Cyclists. PLOS ONE.
[2] Leo, P. et al. (2022). The Compound Score in elite road cycling. Conference: Science and Cycling 2022


