Table of Contents
Definition of power and watts in cycling
When referring to watts in cycling, we are talking about power, which is the amount of work that can be generated per unit of time, whose units are watts (W). In other words, how much energy can you expend in a given time. If you generate 30,000J of energy for 60s, you will be generating a power of 500W (30,000/60 = 500).
This power in the case of cycling can be calculated as: power (watts) = force (applied to the pedals in Newtons) * length (of the crank in meters) * cadence (in radians per second). As it can be seen from the formula, power depends on three factors, force, crank length and cadence. Of these three values only two vary, power and cadence. Bearing this in mind, to generate more power and therefore go faster, we have three options: the first is to increase the force applied to the pedals while maintaining the cadence, the second is to maintain the force applied but increase the cadence, and the third increase both at the same time.
For this reason, average professional cyclists tend to ride at higher cadences than amateurs. Because due to their experience with training they have not only developed greater intermuscular coordination that allows them to move the pedals at a higher cadence without losing efficiency, but also that due to the fact that they generate greater power outputs they must also have higher cadences. Since if this were not the case they would have to increase the levels of force applied in a greater extent. Therefore, in most cases, notable improvements in power end up coming from the third option, increasing the applied force (or torque (Nm) if force * length of the crank are considered together) and increasing also the cadence. This is also where the arguments that defend prescribing certain training sessions for torque and cadence in addition to power come from.
Power in training
The value measured by the powermeter is the power output, not to be confused with power input, which is the one that depends on the energy consumed (calculated through VO2 max). What relates these two concepts is the mechanical efficiency that will be explained in a later post.
Power is a key factor for cycling training since, in addition to being an ideal tool for prescribing training zones and performing specific tasks, it has less variability with respect to heart rate and is a clear representation of the performance of a cyclist. Therefore, to determine if a cyclist is in shape, it is not necessary to carry out field tests assessing the distance (something that can present great variability due to environmental conditions) or assess race results (which depend on many more factors than just the purely physiological). And apart from looking at only one determining factor of performance several of them can be looked at such as assessing the power profile (normally tests of 5 seconds, 1 minute, 5 minutes and 20 minutes) and therefore not only assessing whether it has improved or not but also what or why has improved.
Power in relation to terrain
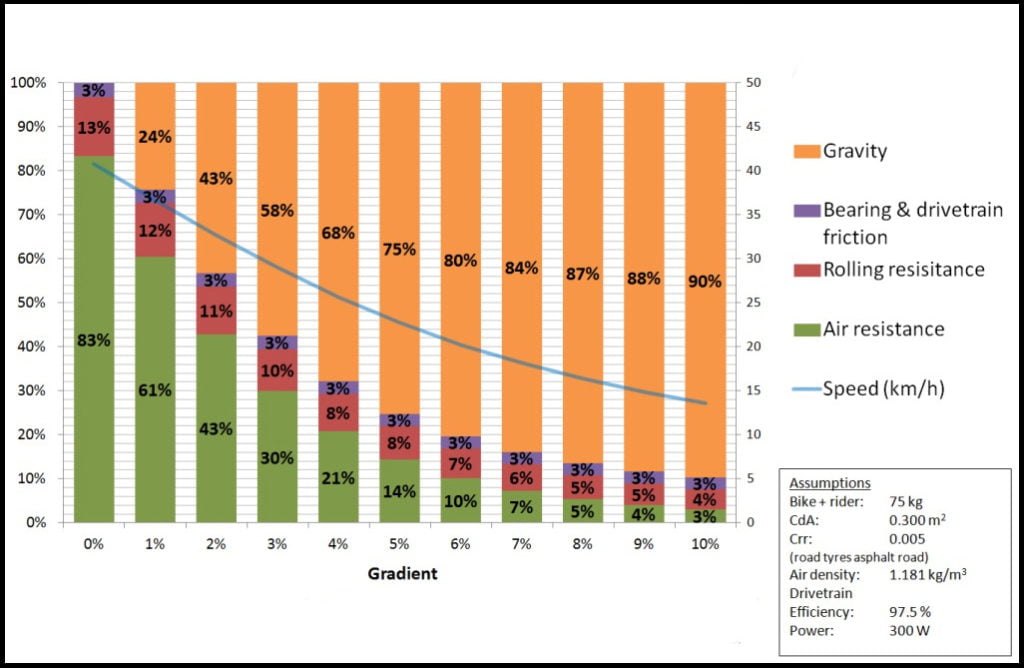
In the case of cycling, the power output must overcome certain forces that vary in magnitude depending on the terrain where the cyclist is riding. These forces are: Weight (gravity), Aerodynamic drag, Rolling resistance and Bearing and drivetrain friction. Thus, it is possible to determine which cyclist is better if the appropriate factors are assessed. For example, going uphill the force to overcome is mainly gravity, which gains importance the greater the slope (see Figure1 below). Therefore going uphill the power/weight ratio will be very important. For this reason the lightest riders are often the best climbers. On the other hand, if you look at what happens on the flat it is the opposite, the force that takes on more importance is Aerodynamic drag. In these conditions heavier cyclists usually perform better since despite having lower relative power values (power /weight) tend to have higher absolute power values and higher power/FrontArea values (which is the main indicator of flat riding performance).

In the graph above you can see the contribution of each of the forces that a road cyclist must overcome at each moment depending on the slope of the road. Estimated data for a 75kg cyclist going at 300W. In orange the Weight, in purple the Bearing and drivetrain friction, in red the Rollind resistance and in green the Aerodynamic drag. It can be seen that from 2% up or down, the weight or the aerodynamic resistance already take the biggest importance.


